R Mapping Bundle
Save 15% by buying both courses together!
The R Mapping Bundle is for analysts who are serious about improving their mapping skills in R.
The Bundle contains two full-length courses which have helped analysts just like you complete challenging mapping projects in R.
By purchasing the R Mapping Bundle you will save 15% over buying the courses individually!
This course is the definitive guide to using Choroplethr. It provides detailed instructions on using the hundreds of maps that Choroplethr contains. In addition to teaching you how to map your own data, it will also teach how you to explore that data using maps!
The course contains 29 lessons. Each lesson contains a pre-recorded video and downloadable code. The maps you will learn to use are:
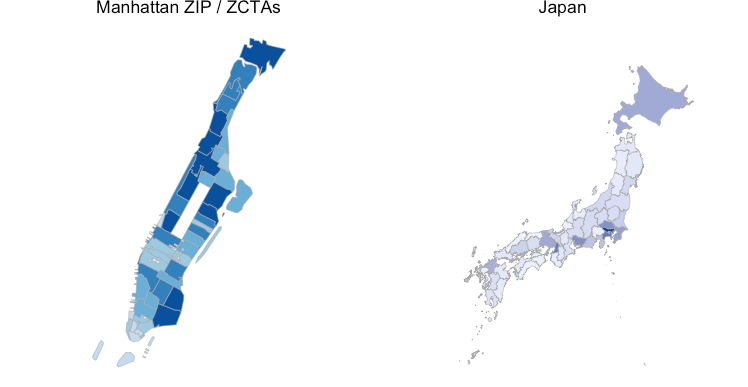
US States, Counties, ZIP Code Tabulation Areas (a ZIP Code approximation) and Census Tracts.
Countries of the world
State / Province Maps (Administrative Level 1 Maps) of 215 countries
Here are some maps from the course you will learn how to create:
"This course is informative and very well paced and presented. Ari also gives you a wealth of resources for projects that will use choroplethr and for future self training. I highly recommend it if you are working with maps in R."
-Charles Smith
This course will teach you the most important skill for tackling advanced mapping projects: how to work with Shapefiles.
Most R programmers are limited to working with maps that come from existing R packages. This is fine if you’re working with a popular geography, such as countries of the world or US states. But if you are trying to visualize local data (such as your own city), then this approach simply won’t work.
The solution is to learn how to work with Shapefiles. Most municipalities publish their geographic boundaries online in Shapefile format. If you know how to work with Shapefiles, then you can edit them, import them into R and use them to visualize your own data.
This course will teach you how to work with Shapefiles by walking you through a real project: mapping the noise complaints in San Francisco by Supervisor District. This is the final map you will create:
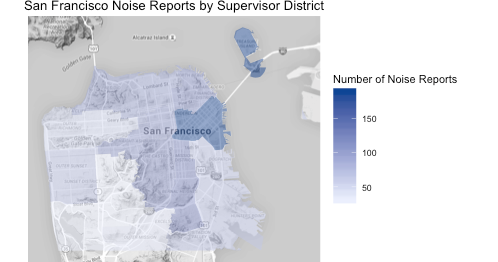
The steps in the project are:
Getting the Shapefile and data
Viewing and modifying the shapefile in QGIS, a “real” GIS program
Viewing and modifying the shapefile in R
Creating the choropleth map with ggplot2 and Choroplethr
This course contains 30 lessons. Each lesson contains pre-recorded video as well as downloadable code.
"Everything you want to know about Shapefiles in bite-sized pieces! Ari gently leads us through the process of using Shapefiles with a series of short but pithy videos. None of the bite-sized pieces is hard to swallow. The ideas are laid out in clear, logical fashion and the videos are just long enough to cover the topic at hand without confusing the viewer with unrelated or extraneous material. It was a pleasure to watch Ari build a series of maps from the same base data, adding new features and pointing out various pitfalls or extra options along the way. I took in the big picture in one pass through the course and I look forward to replaying individual sections for reinforcement when I tackle new projects."
-John Beltrami
Both courses are taught by Ari Lamstein, an R Trainer and Consultant located in San Francisco, California. Ari is the author of several popular R packages, including Choroplethr. He has spoken internationally on mapping demographic statistics in R.
Here are all the courses that are included in your bundle.

